One commentator recently claimed, only 3 times in the last century were both the
Stock Market and the Bond indices down simultaneously and almost equally bad.
However, two of the three times happened within the last 15 years, which could
indicate that this rare Black Swan phenomenon may no longer be an isolated event.
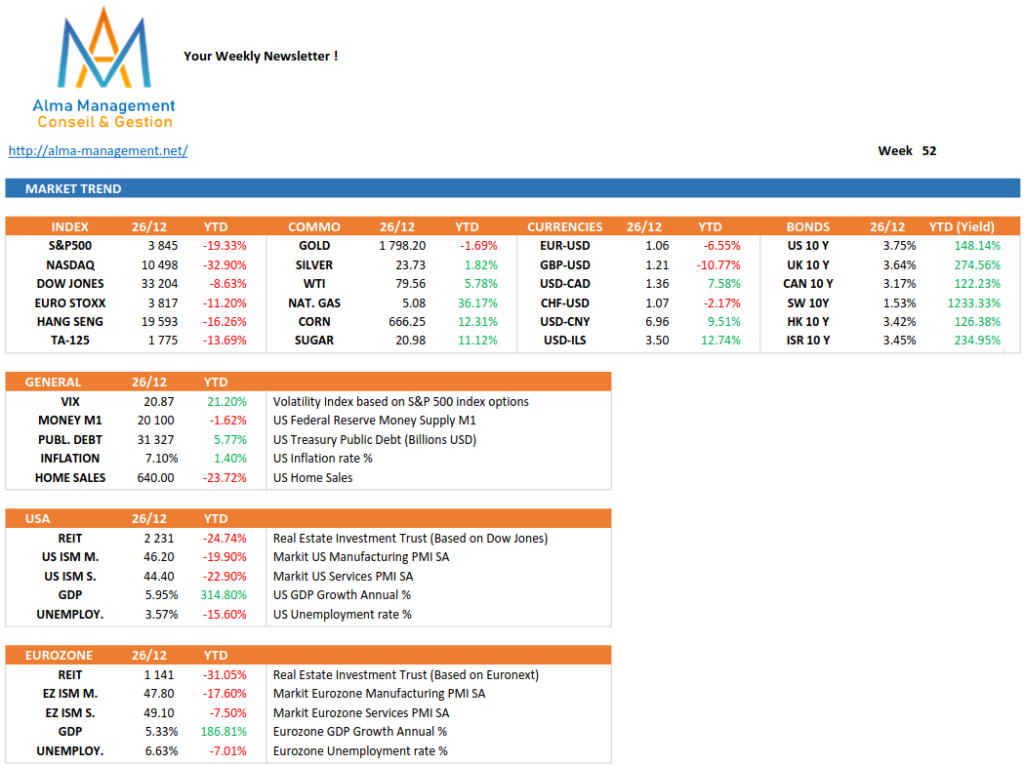
Not only was the downturn bad in the developed countries, it was generally worse
in the rest of the World. In short, there was no place to hide. Here is a summary
from a local investment house.
The big question on everybody’s mind is, what to expect in the new year and
beyond?
The prognostications are mixed.
Most market letters we have seen expect a big pick-up in the coming year, after a
particularly bad year, which is logical. The accompanying compilation of recent
articles gives summaries of some of the negative opinions.
Based on recent history (as far back as most of us can remember as adults!) the
expectation is that markets are overdue to take off again, just like we have seen in
the past.
Here are some sobering graphs, easily found on the internet, that may be
indicating another story.
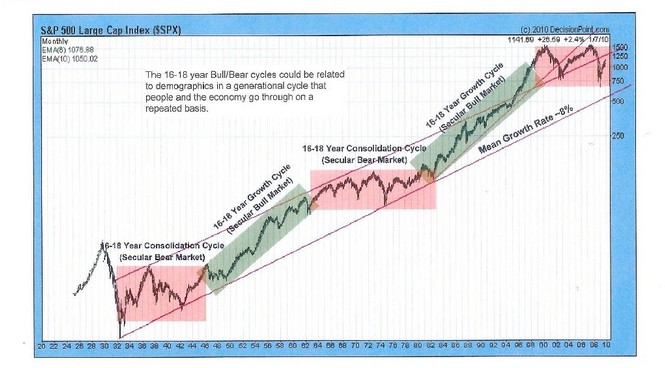
https://www.stockideas.org/long-term-charts-us-stock-market-sp-and-dow/
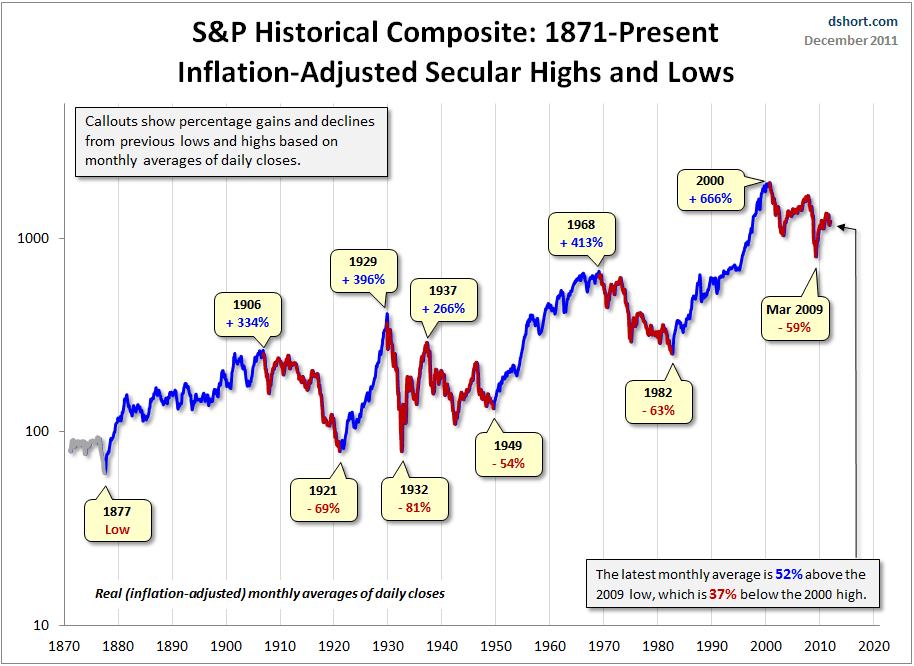
Although this graph ended 12 years ago, we can see a pattern that almost all
stock market pundits fail to know or share. There can be extended periods where
the markets do very little positive, if looking at the major indices.
This does not mean that sector investing will not achieve good results. Not
everything works in tandem, as can be seen by the following sector report. This is
why 21CA does regular buying and selling, trying to steer to where there is positive
action in over 100 unique investment areas that include foreign Markets,
commodities, sub sectors, etc
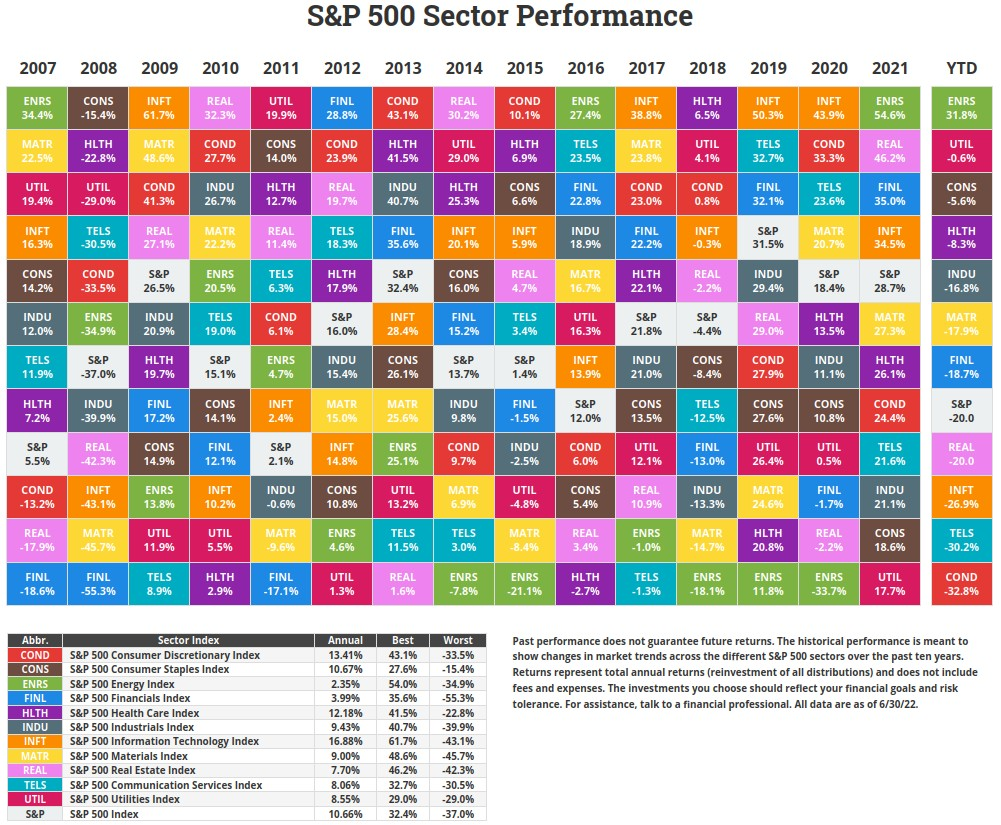
https://novelinvestor.com/sector-performance/
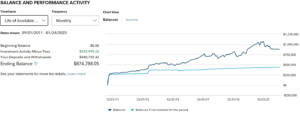
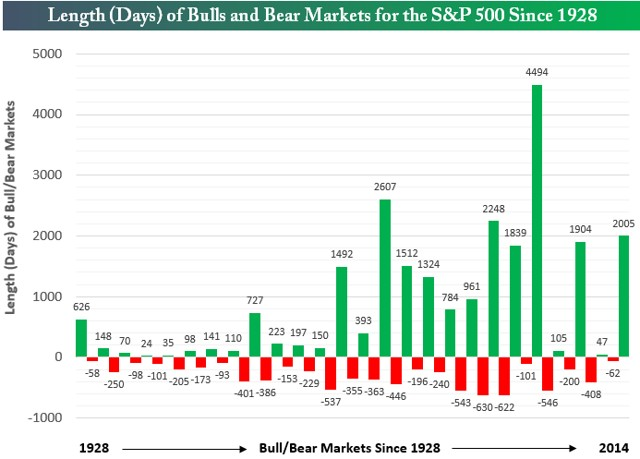
In case you are discouraged, the following is why we invest. Overall, with
patience and a proven plan, it pays off nicely. Sometimes the majority is in cash,
like now. When markets are doing well accounts are nearly fully invested
http://www.businessinsider.com/henry-blodget-140-years-of-bull-and-bear-markets-2009-4
Another way of looking at it
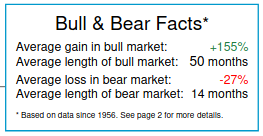
1955 – 2015, Mackenzie Investments
https://studylib.net/doc/5313270/bull-and-bear-markets–sandp-500-chart
https://www.advisorperspectives.com/commentaries/2016/08/29/bulls-bears-the-broken-clock-syndrome?
channel=Mutual%20Funds
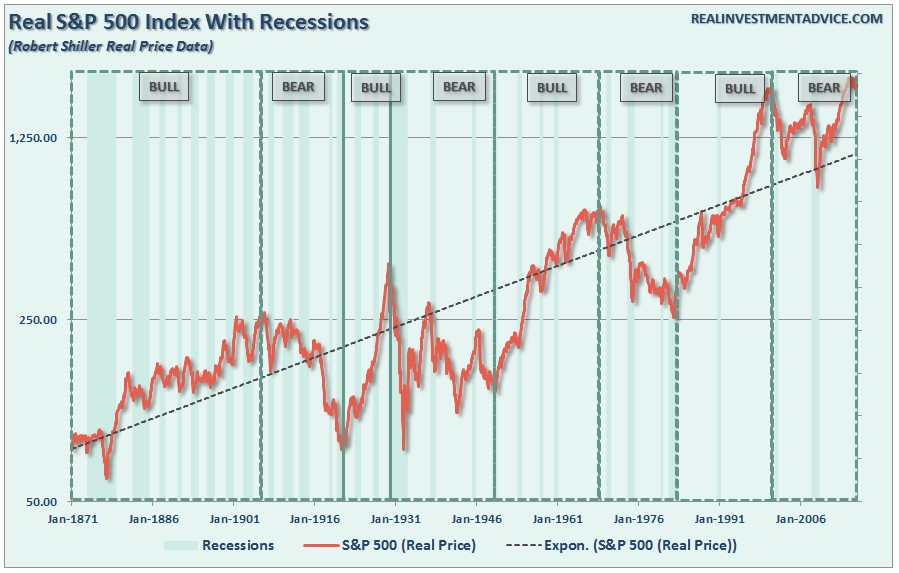
The above chart ended about 2015.
Please note that performance of investments does not correlate very closely with
recessions. Thus all the talk of 2023 being a recession year will not necessarily affect
investment results. Also, note that governments and central banks appear to be doing an
ever better job in avoiding recessions; the interval between recessions is getting longer and
the depth might be shallower.
Our guess: The fundamental factors were mentioned in previous Market Reports.
Markets have possibly entered a longer than usual consolidation period, perhaps for
several years. The markets when viewed from the perspective of the broad indices will
appear dead or unstable.
However, there will be significant returns by concentrating on specific sectors and the
bold will do well. In the last half year, some leading Hedge Funds have shown new life,
after having severely under-performed since 2009. Unfortunately, these are not available to
the average investor.
If a horizontal market is going to persist, our Technical Trading system should outperform;
as it uses a trend following system to look for opportunities. Expect Buy and Hold portfolios,
60/40 splits between Shares and Bonds and other traditional systems to under-perform and
perhaps continue to yield negative returns.
Regardless of what happens, our trend following system, for over a quarter century, has
been providing reliable returns in most years by following whatever trend appears.
Do not hesitate. Allow us to do a free review of your current portfolios, and then compare
it to the 21CA Technical Trading approach

Here is a review of the same big funds, our comparative peers, that were last visited 3 months ago.
The very biggest funds.
American Funds Growth Fund of Amer A
Continued to lose, 1 year return
AGTHX
−31.21%
Among those that were considered the best funds of all time.
Fidelity® Growth Company
Has declined further, 1 year return:
FDGRX
−35.76
Vanguard Total Stock Mkt Idx Adm
Has not changed, 1 year return:
VTSAX
−20.27%
Fidelity® Select IT Services
Has not changed, 1 year return:
FBSOX
-30.11%
PIMCO Total Return A
Has declined further, 1 year return:
PTTAX
−14.62%
Vanguard PRIMECAP Inv
Has improved, 1 year return:
VPMCX
−16,00%
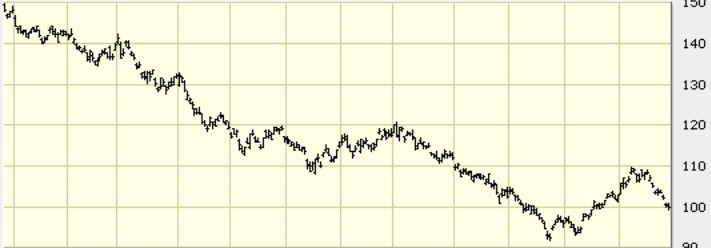
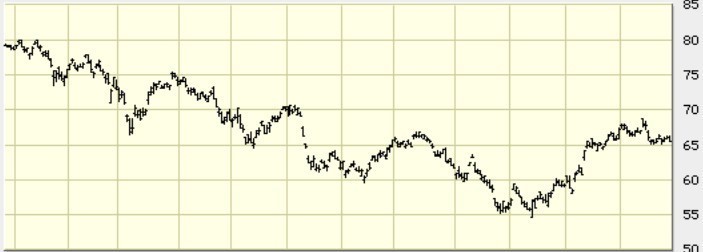
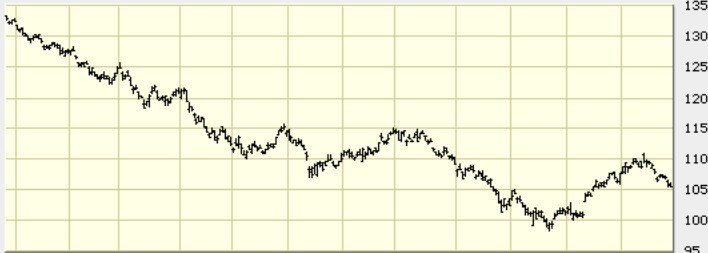
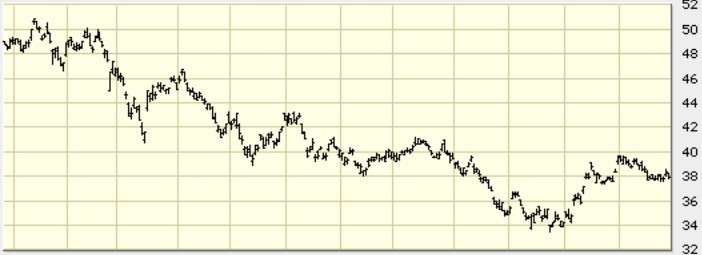
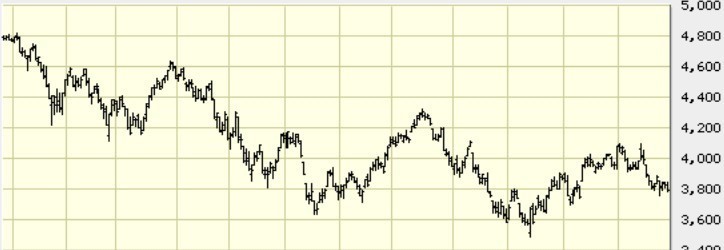
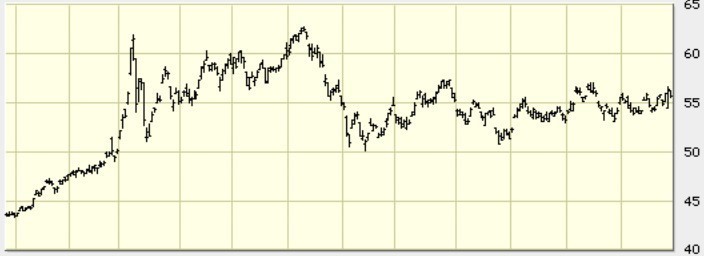
Here are 1 year graphs for the same Indices covered previously.
TLT iShares 20+ Year Treasury Bond ETF
EFA iShares MSCI EAFE ETF
LQD iShares iBoxx $ Investm’t Grade Corp Bond ETF
EEM iShares MSCI Emerging Markets ETF
SPX S&P 500 Index
USCI United States Commodity Index Fund
Sources: Bigcharts.com & Morningstar.com